
Expert TGA Guide: Thermogravimetric Analysis, Curve Interpretation and Selection
How do the best in the business stay so sure that their materials will hold up when things get seriously hot?
Total confidence in a material’s thermal limits is essential for any high-end production line — and a Thermogravimetric Analyzer (TGA) is the heavyweight champion of the lab bench for providing that peace of mind. Think of a TGA as a super-sensitive scale that lives inside a high-heat furnace: it tracks exactly when your sample starts losing weight as temperatures climb, cool or hold steady.
As a professional manufacturer of thermal analysis instruments, Baoruitong Automation Equipment Co., Ltd. (BRT) presents this expert guide to TGA — what the instrument measures, how to interpret TGA curves, and how to choose the right thermogravimetric analyzer — featuring the BRT TGA-1450B, engineered for high-temperature thermal testing up to 1450 °C with 0.01 mg weighing precision.
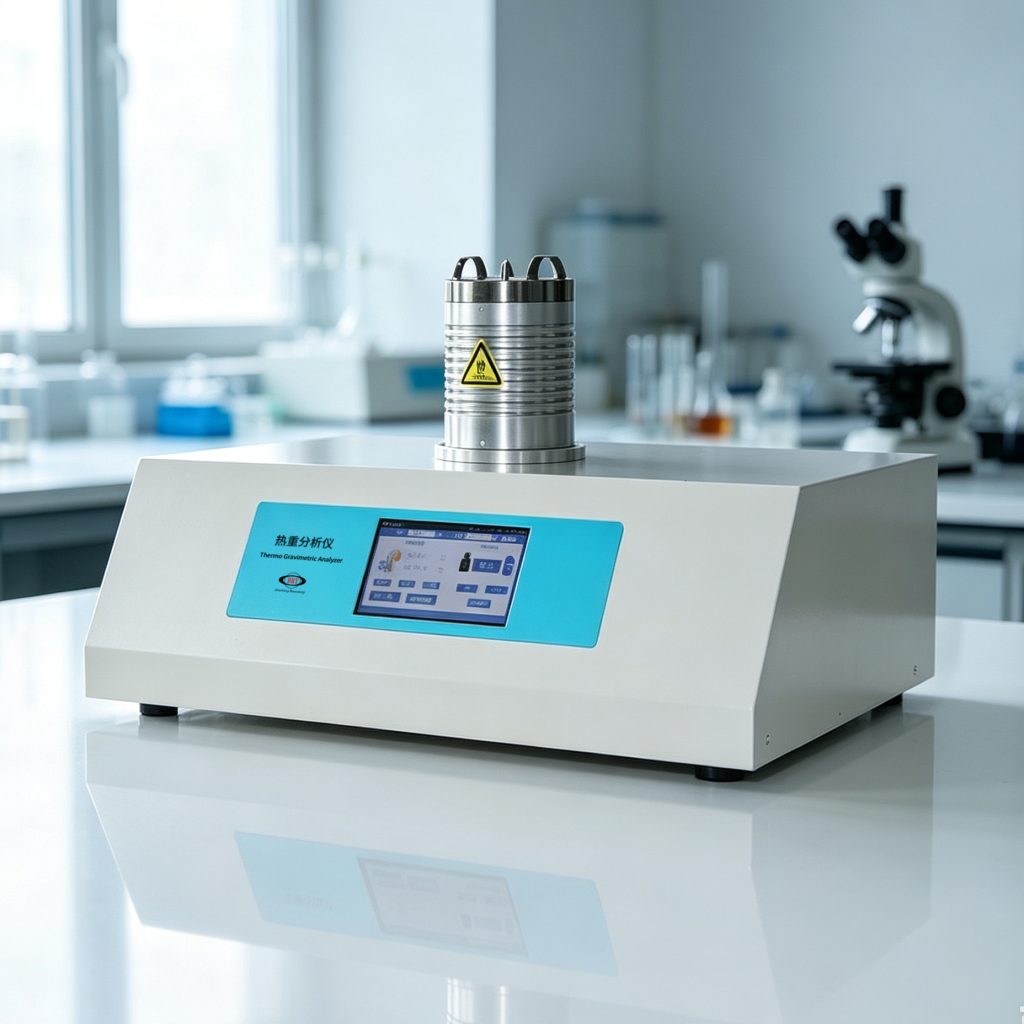
What Is a Thermogravimetric Analyzer?
A TGA keeps a close watch on how much a sample weighs while it is heated under a tightly controlled gas atmosphere, quantifying major shifts such as thermal decomposition, oxidation and volatile loss. Every material behaves differently when the heat is on — some lose weight because components evaporate, others break apart — and TGA delivers the “make or break” data that tells you whether a material will survive its service conditions.
Three main components do the heavy lifting:
- The high-sensitivity microbalance — the beating heart of the operation, picking up even the tiniest weight shift
- The controlled heat chamber — the furnace that follows a precise heat path, from room temperature to extreme high heat
- The gas-flow controller — testing happens inside a specific gas bubble: nitrogen to see how materials fall apart on their own, or oxygen to see how they burn
TGA and DTG Curve Interpretation
The data a TGA produces looks like a wiggly line on a graph called a thermogram. On the graph, the bottom line shows temperature and the side line shows weight. As things get hotter, the line stays flat until something big happens — then it takes a sudden, craggy dive.
Take a classic textbook case: testing a standard chunk of PVC plastic. As heat climbs, a tiny, barely-there dip appears at the start — surface dampness sweating off. Push the furnace hotter, and a massive, craggy drop-off appears as the main plastic components break down. Whatever heavy, unmelted material is left at the bottom of the pan is the inorganic ash or glass fiber — the whole story laid out in front of you.
For easier reading, the DTG view turns slow weight drops into sharp, highly visible peaks that pinpoint the exact moment of maximum decomposition rate.
Factors Affecting TGA Curve Results
Results change based on how the test is run. The primary factors affecting TGA curve data:
- Heating rate — crank the heat too fast and decomposition points may look higher than they actually are, and separate reactions mash together into one tangled pile of data. For example, running a coal sample at a steady 10 °C/min gives clear, sharp drops, while 50 °C/min blurs everything together
- Gas atmosphere — a burning (oxidizing) atmosphere changes everything compared to an inert one
- Sample preparation — choosing the right crucible (platinum for high temperatures, alumina for stability) and keeping samples small and crumbly ensures heat spreads evenly
Primary Purposes of TGA Analysis
- Checking heat toughness — finding the exact moment a material starts to degrade
- Finding hidden water — measuring trapped moisture or solvent, critical for pills and food products
- Figuring out the recipe — quantifying fillers such as carbon black in rubber compounds
- Watching chemical reactions — oxidation and burning behavior at high temperatures
Industrial Applications of TGA
- Plastics and rubber — checking filler content and heat tolerance; a tire factory routinely uses TGA to determine the split between raw rubber and carbon black filler
- Pharmaceuticals — measuring moisture and verifying shelf stability of drug products
- Fuels and petrochemicals — analyzing the composition of coal and new bio-fuels
- Food and cosmetics — assessing how long products last before they degrade
TGA vs. DSC: What’s the Difference?
A question laboratories ask constantly: should I choose a TGA or a DSC? The short answer — TGA follows the weight (did it get lighter or heavier?), while DSC follows the heat response (such as melting points). Run a TGA test to see when a material burns up or evaporates; use DSC to find melting or freezing points. Combining both methods helps separate physical shifts from actual chemical breakdown.
Calibration and Maintenance
A TGA is only as trustworthy as the last time its accuracy was checked. Routine check-ups using officially certified weights keep the sensitive microbalance behaving perfectly, and Curie point standards — clever magnetic metals that lose their magnetic pull at exact, unchanging temperatures — keep high-temperature readings accurate for the long haul. Standards such as ASTM D3173 (moisture) and ASTM E1131 (compositional analysis) keep data defensible when inspectors come knocking.
How to Choose a Thermogravimetric Analyzer
When choosing a TGA for your facility, focus on these areas:
- Temperature range — make sure the furnace can handle your most demanding samples, from standard polymers to high-temperature ceramics
- Microbalance sensitivity — a scale that can feel tiny weight shifts is essential for catching every drop in mass
- Automated gas control — a system that switches between nitrogen and oxygen atmospheres automatically mid-test
- User-friendly software — the program should handle the math and curve-drawing on its own, and adapt to your workflow
BRT TGA-1450B: High-Temperature Thermal Analysis Solution
The BRT TGA-1450B thermogravimetric analyzer is built to meet these requirements:
High temperature and precision
- Temperature range from room temperature to 1450 °C with 0.01 °C temperature resolution — covering standard polymers and high-heat materials
- TG resolution of 0.01 mg with a balance range of 0.01 mg–2 g, based on the electromagnetic force balance principle (bottom-pan weighing system)
- Heating rates 0.1–80 °C/min, cooling rates 0.1–30 °C/min (constant-rate cooling above 100 °C)
Automated gas control and thermal isolation
- Two-channel automatic gas switching between nitrogen and oxygen, with fast switching and short stabilization time
- Built-in water bath insulation isolates the balance from the high-temperature furnace, protecting measurement stability
Smart operation and data handling
- Industrial-grade touch interface displaying set temperature, sample temperature, thermogravimetric signal and switch states
- User-programmable automatic test procedures — combine dozens of software commands into one-click workflows
- Gigabit Ethernet connection with automatic connection recovery; software compatible with Windows 7/8/10/11 and any screen resolution
- Detachable, replaceable sample holder for easy cleaning and maintenance; fully imported chip and sensor
- Compact integrated fixed furnace (70 × 44 × 42 cm, 50 kg), power 1000 W
Who Needs the TGA-1450B?
- Polymer and rubber manufacturers — filler content, carbon black and thermal stability analysis
- Pharmaceutical companies — moisture and shelf-life testing
- Coal, bio-fuel and petrochemical laboratories — compositional analysis of fuels
- New energy and inorganic materials research labs — high-temperature thermal testing
- Universities and research institutes — thermal analysis teaching and research
FAQ
What is a thermogravimetric analyzer used for? A thermogravimetric analyzer tracks the exact weight changes of a sample as it is heated inside a highly controlled furnace — measuring heat toughness, hidden moisture content, and the composition of rubbers, plastics and fuels through thermal decomposition and oxidation behavior.
How do you interpret a TGA curve? Start with the thermogram: the bottom line tracks temperature and the side line tracks sample weight. The line stays flat until the material starts breaking apart, then shows a sudden downward slope. The DTG view converts slow weight drops into sharp peaks that pinpoint the moment of maximum decomposition rate.
What is the main difference between TGA and DSC? TGA measures how much weight a sample loses during heating, while DSC measures heat response (such as melting points) without weight loss. Use TGA to see when material burns or evaporates; use DSC to find melting or freezing points.
What are the main factors affecting the TGA curve? Heating rate, gas atmosphere and sample preparation. Fast heating blurs reaction points together; oxidizing vs. inert atmospheres change behavior completely; and small, well-prepared samples in the right crucible ensure even heat distribution.
Which standards apply to TGA testing? Common standards include ASTM E1131 for compositional analysis and ASTM D3173 for moisture determination. Routine calibration uses certified weights and Curie point standards to keep measurements accurate.
Get a Quote
Need a reliable thermogravimetric analyzer for high-temperature thermal testing? Contact Baoruitong Automation Equipment Co., Ltd. today for the TGA-1450B datasheet, test procedure guidance and a customized quotation. Every BRT instrument is backed by a 1-year warranty, installation guidance, operation training and long-term after-sales support.
Email: info@brt-test.com | WhatsApp: +86 15604057553 | Web: www.brt-test.com